Inflation is slowing in San Marino. In June 2026, consumer prices for households of blue- and white-collar workers rose 1.11% compared with the same month in 2025, net of tobacco. The figure remains positive, but is markedly more contained than the +1.73% recorded in May and the +2.01% seen in April.
The slowdown follows the peak reached in March, when inflation hit +2.30%. Since then the curve has been gradually declining, although behind the overall figure lie very different situations depending on what ends up in the shopping trolley or which expenses households face.
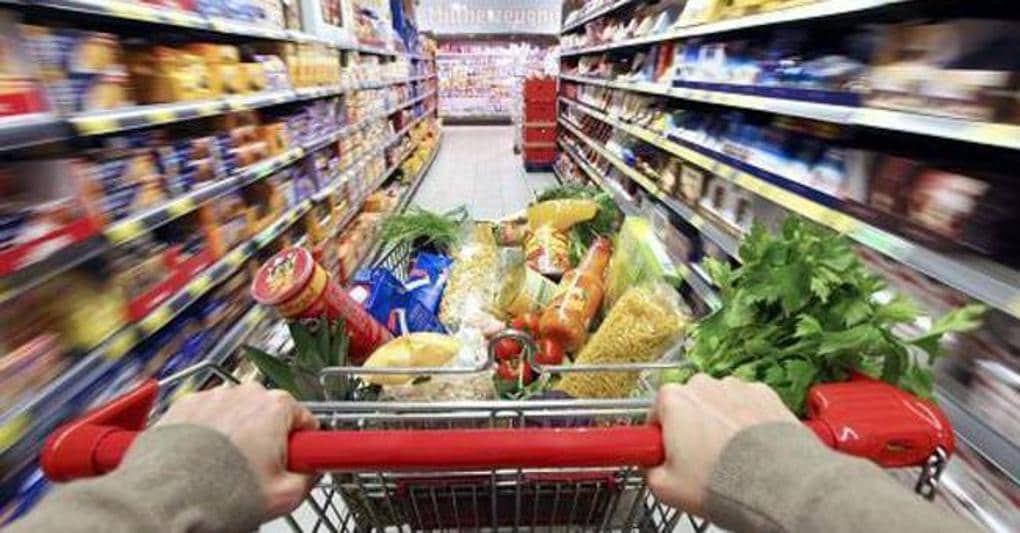
On the food front, for instance, prices are still rising by 1.51% year-on-year. The main driver is vegetables, which jumped 9.11% compared with June last year. Increases were more modest for meat, up 2.53%, and fruit, up 1.87%.
Some products, however, have moved in the opposite direction. Oils and fats fell by 6.68%, while cereals recorded a 1.04% decline. The drop in oils and fats should nonetheless be read in light of the sharp increases of recent years: prices rose on average by 21% in 2022, 30.4% in 2023 and a further 17% in 2024. As a result, by 2025 they were still roughly 77% higher than in 2021. The current decline has therefore only recovered a fraction of the accumulated price rises.
The pace is also shifting for coffee. After the +18.2% recorded in January, year-on-year growth has progressively deflated to just +1% in June.
One of the most striking slowdowns, however, comes from transport. In June the sector recorded -0.24% compared with a year earlier, after +3.01% in May and as much as +5.20% in April. Behind the reversal lies mainly the fall in fuel prices within San Marino, with declines affecting petrol, diesel and LPG.
Not everything, though, has become cheaper. Housing, water, electricity, gas and other fuels rose by 3.24% compared with June 2025. Restaurants and accommodation services also climbed, up 2.90%, along with alcoholic beverages and tobacco, up 1.71%, and health, up 1.31%.
Bucking the trend is the information and communication sector, where prices instead fell by 0.87%.
The June picture thus points to overall milder price pressure compared with spring, though with still marked differences across spending categories. Since January 2026, moreover, the indices have been published using the new ECOICOP v2 classification and a 2025=100 reference base, while maintaining comparability with the previous year’s data.